Chart for 2000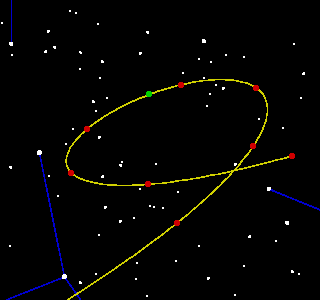 | Chart for 2023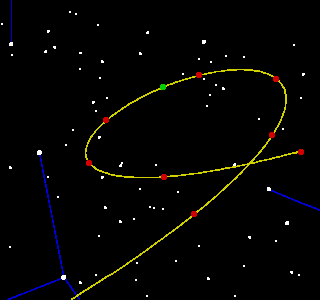 |
| Date and time of opposition: 22nd March, 8:39am Distance to Earth at closest approach: 239.43 million km | Date and time of opposition: 21st March, 7:33am Distance to Earth at closest approach: 239.21 million km |
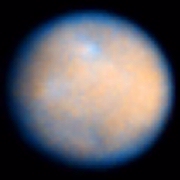
On the page showing my observations of Ceres (in the "My Astrophotographs" section), I remarked that in the 9yrs between the oppositions in 2000 and 2009 Ceres slipped back from 61/2wks after a particular point in its orbit to 71/2wks before it. I shall here explore the reasons for this and then extend the analysis to find some even better alignments.
I then move on to a quite different type of periodicity in the orbit of Ceres, due to perturbations caused by its proximity to the giant planet Jupiter. I finally analyse the effect of these perturbations on the orbit of the other major asteroids, finding similarities but also subtle differences.
The mean orbital period of Ceres is 4.603yrs, giving it an average synodic period (the time between successive oppositions) of 1.277yrs. Seven such intervals add up to 21days less than 9yrs. In this time Ceres will have completed not quite 2 complete orbits, needing about a further 97 days (on average) to get back to where it started. This explains the observation on the "Ceres astrophotographs" page, as the sum of the date differences noted there is 98 days, in agreement with the calculation. The odd day difference is because the time between successive oppositions is not actually constant, due to Ceres' variable speed in its quite eccentric orbit, and so the sum of seven particular synodic periods is unlikely to come to exactly the mean value.
The repeat based on 7 synodic periods is reasonably good, but that based on 18 periods is very much better. This interval is just 2 days short of 23yrs, and 83/4days (or just 0.5%) short of 5 orbits of Ceres. This means that oppositions 23yrs apart will be very similar indeed, both in their date (and thus their position in the sky) and in other things such as distance and opposition-loop shape. This is illustrated by the oppositions of 2000 and 2023, whose charts are given below. The stars are now in Virgo, and the tracks start on 1st December of the previous year.
Chart for 2000 | Chart for 2023 |
| Date and time of opposition: 22nd March, 8:39am Distance to Earth at closest approach: 239.43 million km | Date and time of opposition: 21st March, 7:33am Distance to Earth at closest approach: 239.21 million km |
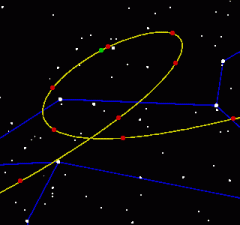 As can be seen, the shapes of the loops are virtually identical, as are the positions of the date markers - the only real difference in the plots is that the loop is shifted slightly to the right in 2023. Also, the loop for 2000 is almost a "mirror image" of that for 2009 (shown on the right), as might be expected from their position each side of the date of most northerly point in the orbit - an opposition exactly at this date would have a loop whose crossing point was directly opposite its "green blob".
The shift between 2000 and 2023 is 1.6deg, corresponding to a time difference of 1day 15hrs (as the Earth moves just less than 1 degree round its orbit per day). This would seem not to be equal to the interval between the oppositions (ignoring whole years) but of course the Earth moves according to "average years", of 3651/4days, but the calendar has years of either 365 or 366 days. Given the distribution of normal and leap years between 2000 and 2023, the difference corresponds to 1day 1hr in calendar time, as required. Similarly, the shift of the plot for 2000 relative to that of 2009 is 24.9deg, corresponding to the 24days 19hrs [calendar time] difference in their opposition dates.
The situation where the opposition loops for dates 9yrs apart at intervals of 23yrs are near mirror-images is only a temporary phenomenon because of the difference of 83/4days in the position of Ceres after the 23yr repeat cycle. As time passes, this discrepancy will cause the opposition on the first of the dates of the pair to get closer to the date of most northerly orbital point and that on the later date to move away from it, thus upsetting the near-symmetry. Following the "46days after and 53days before" pattern of 2000/2009, the oppositions in 2023/2032 will be 39days after and 60days before: a continuation of this date shift will soon result in distinctly different loop shapes. Working in the other direction, for the date pair 1977/1986 the situation would in fact have been the exact reverse of that in 2000/2009: the earlier opposition would have been 54days after the point with the later one 46days before it. The loop for 1977 would thus have looked like that for 2009 and that for 1986 like 2000. Earlier 9yr pairs would experience a shift identical to that for 2023/2032 (though in the opposite sense), again resulting in different loop shapes before very long. It is thus clear that the "mirror-image effect" will only last for a couple of 23yr cycles.
This is only considering the most-northerly point of the orbit, however - exactly the same alignments can occur near the most-southerly point. In these cases the opposition loops will have the same basic shapes but will be "upside down" i.e. the crossovers will happen above the loop rather than below it. It will take over 2800yrs for the alignments to move round half an orbit, however, so I'm not exactly making plans to observe the event!
The mis-alignment of pairs of oppositions in a particular 23yr cycle will continue to get worse as time passes, but of course the alignment for pairs in other cycles will, at the same time, be getting steadily better as they approach the northernmost point. However, due to the rather large shift in position from one opposition to the next, this happens exceedingly slowly. There are (on average) 466 days between oppositions and 1681 days in a full orbit for Ceres so if a given opposition occurs at a particular point in the orbit, the nearest opposition to it will be that happening 4 opposition periods later. However, it will still be around 183 days away (1681-4*466) so at 83/4days per 23yr cycle it will take 21 cycles to close the gap - this is 483 years!
The above analyses used the most-northerly point in the orbit as the position of interest, as it is proximity to this point that determines the shape of the opposition loop. Clearly, however, any other point on the orbit will also have alignments with oppositions. A particular case is the nearest point to the Sun (perihelion), when exact alignments rather than "before and after" effects will be of interest. There is a serious complicating factor with perihelion though, in that the period between successive perihelia varies considerably, as does the actual perihelion distance. This is mainly due to the perturbing effect of Jupiter (though the other planets have an effect), in much the same way that the Moon's orbit is perturbed by the Sun and the Earth. Thus although such things as the 23yr cycle still apply, the perturbations swamp any effect of long-term periodicities. There are are still some interesting conclusions to be drawn, however.
I mentioned on the Ceres page that the 2009 opposition was the closest to the Earth since 1857. The reason for this is to be found in the complex interplay between perihelion alignment and perihelion distance. In 2009, opposition was 15.48 days after perihelion. In 2032 (23yrs later) the difference will be 11.38 days, which should produce an even closer opposition. However, because the perihelion distance will be slightly greater then, Ceres will actually be a little further away. Even more marked, after another 23yrs the difference will only be 1hr 22min but the 2045 opposition will again be further away because the perihelion distance is now much greater. Moving in the opposite direction, at the previous very-close opposition of 14th Feb. 1857 not only was the difference less than in 2009, at 13.76 days, but the perihelion distance was also smaller. The two factors added up to give a very close opposition (helped by the fact that the Earth would have been very slightly further away from the Sun in 1857 compared to 2009 as it was 2wks closer to its own aphelion). Again, although the difference at the opposition 23yrs previous to this was only 1.29 days, the perihelion distance was greater leading to a slightly more distant approach in 1834.
It is notable that the "most northerly orbit point" and perihelion alignments (currently) happen at about the same time - about 10wks apart, in fact. This is pure coincidence though, reflecting the fact that Ceres' orbit just happens to have these two points fairly close to each other at present. They are actually about 17deg apart which, it would seem, would take Ceres 80days to cover. The actual (mean) value is 68days though because it is moving faster than average at this time due to being near perihelion. Incidentally, I said "currently happen at about the same time" because, like all orbits, the fixed points are not actually fixed but slowly move round the orbit in a process called precession. This is extremely slow for the Earth (its perihelion precession period is of the order of one hundred thousand years) but very much faster for the Moon (tens of years) due to the different distances and orbital periods involved. Precession will cause the angle between the most northerly orbit point and perihelion to change because the laws of orbital mechnics dictate that they move in opposite directions and at different speeds. In fact the angle is closing up at the moment, and will continue to do so for another 500yrs or so.
I investigated this phenomenon by plotting the celestial longitude of the perihelion and "most northerly" points from orbit to orbit. [Celestial longitude works in much the same way as longitude on Earth - it measures how far round its orbit a body is. Just to be awkward though, it is measured in an anti-clockwise direction]. I also calculated two sets of data based on the time interval between successive perihelia and between successive passages through the most-northerly point. To put these into context, I needed to determine a mean value for the orbital period (which, like everything else, is affected by perturbations), for which I used the time difference between the instants at which Ceres passed the zero line of celestial longitude - just like finding the mean length of a day by timing when the Sun crosses the Greenwich Meridian. And just in case you're wondering, all three data sets were calculated using the Solex program written by Professor Aldo Vitagliano of the University of Naples, which takes into account perturbations as well as the more straightforward orbital motions.
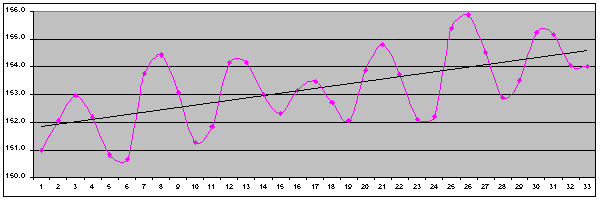
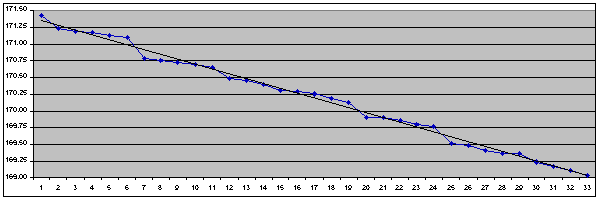
As shown by the upper diagram above, the longitude of perihelion showed an increase of the mean value with time, indicating that the perihelion point moves (or "precesses") in the same direction as Ceres orbits [i.e. anti-clockwise], as theory requires. Conversely, the longitude of the most-northerly point (lower diagram) showed a decrease in mean value, showing that it precesses in the opposite direction, again consistent with theory. Regular fluctuations due to the perturbations were also present, as expected, though they were of considerably smaller magnitude in the case of the most-northerly point.
I found that the mean p-to-p time was slightly greater than the mean orbital period i.e. Ceres has to go fractionally further than one orbit each time to reach the next perihelion. This confirms that the precession of perihelion is in the same sense as Ceres orbits. The mean time between most-northerly instants was slightly less than the mean orbital period, confirming that this point precesses in the opposite direction to which Ceres orbits.
To get a better estimate of the precession rates, I plotted more points than are represented by the above diagrams - enough points to span 600yrs, in fact! These showed that the perihelion point would precess by one complete rotation in 19707yrs and the most-northerly point by one rotation (in the opposite sense) in 22892yrs. These numbers are clearly excessively precise, but I think 20,000yrs and 23,000yrs could be justified as reasonable answers. Taken together, these values mean that the perihelion point and the most-northerly point are moving towards each other at 3.40deg/century i.e. in 505yrs (2514 AD) they will align. Calculating the same interval by plotting the points on two graphs and seeing where the trend-lines intersected gave an alignment time of 518yrs (2527 AD). Using Solex to check this result shows that the minimum angle between perihelion and the most-northerly point is in fact achieved in 2520 AD - just 0.24deg. This date is right in the middle of my two estimates! The variation is, as you can probably guess, due to the perturbations again. What we are trying to do is find the time when two "wiggly lines" will cross given only the general trend of each one - this will clearly depend on the exact behaviour of the wiggles at the point the graphs are getting close together. Considering this complication, I think the agreement is really rather good.
Time now to discuss those annoying perturbations, I think!
The asteroid belt is in a rather delicate position in the solar system - small bits of rock orbiting close to the largest planet (Jupiter). Indeed, it is thought to be the influence of Jupiter that stopped the asteroids coalescing into a planet when the rest of the solar system was formed. Its strong gravitational attraction disturbs their orbits very substantially, meaning that every parameter (distance to the Sun, inclination, orbital period, orientation of the orbit etc.) is subject to periodic variations of significant proportions [well - significant by astronomical standards, anyway!]. If these perturbations build up from orbit to orbit they can become large enough to eventually throw an asteroid completely out of position, resulting in it leaving the main belt. Build-up will happen if there is a simple relationship between the orbital period of the asteroid and that of Jupiter, so that Jupiter "tugs" at the asteroid at the same places in its orbit each time. For example, in a 3:1 "resonance" (as these relationships are called), the perturbations will always be exactly 180deg apart each time, leading to a rapid shift in orbital parameters.
A body's orbital period is determined by its mean distance from the Sun, so the end result of such resonances is to clear out asteroids whose orbital distance corresponds to a resonant period, thus leaving "gaps" in the asteroid belt. For example, the 3:1 resonance happens at a distance of 2.50 astronomical units (AU). The next two most significant resonances are 5:2 and 7:3, corresponding to 2.82 AU and 2.95 AU respectively. The gaps at these "forbidden" distances are called Kirkwood gaps, after the astronomer Daniel Kirkwood who discovered them in 1857. At 2.767 AU, Ceres is too far from the 5:2 resonance distance to be ejected but it will still experience significant disturbances, as I discovered. The figure below shows a typical example - the perihelion distance of successive orbits.
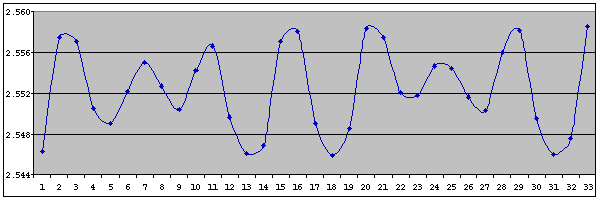
The periodicity of the fluctuations is somewhat irregular but averages out at about 41/2 orbits. We also see that the magnitude of the fluctuations is variable and probably periodic, though the periodicity is not clear. It is reasonable to assume that the perturbations will be at their strongest when Ceres and Jupiter are closest together i.e. when they are in heliocentric conjunction. The average interval between such conjunctions is 1.634 orbits (of Ceres) and so the best match to the periodicity of 41/2 orbits shown by Figure 1 would be 3 conjunctions - this is 4.90 orbits however. So what's going on?
The answer to the above question lies in the fact that to affect the orbital parameters the perturbations need to be not only strong but also at the correct place in the orbit. Orbital mechanics tells us that a body's perihelion distance can most easily be changed by affecting its orbital speed at aphelion [the proof of this comes later!]. To properly investigate the periodic variations we thus need to consider how far a given Ceres-Jupiter conjunction is from the point at which Ceres is at aphelion. A perturbation occurring during a conjunction exactly at aphelion will have the maximum effect on the perihelion distance but, because conjunctions do not happen at intervals of an exact number of orbits of Ceres, they will steadily fall out of alignment with aphelion: this will reduce the effect of the perturbations. For example, after a couple of 3-conjunction cycles (each cycle taking 4.90 orbits) the point of conjunction will have slipped out of alignment with aphelion by 0.2 of an orbit - enough that the alignment after just 5 conjunctions is actually better, leading to a greater perturbational effect after 5 conjunctions than after 6. To see this, observe that 2 conjunctions take 3.27 orbits. A sequence of 3+2 conjunctions will thus take 8.17 orbits - just closer to a whole number than the sequence 3+3 (9.81 orbits). Even if you want to call that one a draw, the situation after a further cycle of 3 is clear-cut: 3+2+3 is 13.07 orbits while 3+3+3 is 14.71 orbits [3+2+2 is just 11.44 orbits, so clearly does not come into consideration]. The conclusion is that although the greatest perturbational effects usually happen after an interval of 3 conjunctions, they sometimes do so after just 2. These "2's" make the periodicity of the fluctuations irregular (i.e. they are actually "quasi-periodic" rather than truly periodic) and decrease the average time between greatest effects. In fact, by extending the above analysis we find that the sum total closest to a whole number is given by eleven "3's" and four "2's" - 67.0075 orbits. The average "cycle time" for this sequence, 67 orbits divided by 15 conjunctions, equals 4.47 orbits (or 20.57yrs), which is the true value of the [average] periodicity shown by the perihelion distance graph.
While this result is pleasing, proving it conclusively is not a topic for the faint-hearted! As usual in these cases I have placed the discussion on a separate page for those who are interested - click here for further details. Suffice it to say though that deeper analysis not only proves my assertion but also gives a reason for the fluctuations in magnitude of the oscillations in the graph above: I call this the "super-period". For Ceres the super-period has a periodicity of 77.12yrs.
During my investigations of the above effects, I contacted the famous mathematical astronomer, Jean Meeus, to discuss my findings with him. He said that he was also working on problems connected with asteroid orbits for his book Mathematical Astronomy Morsels V and mentioned that other asteroids also exhibit periodicities in their perihelion distance, quoting 44yrs for Vesta and 91yrs for Hygiea. This intrigued me, as these values seemed rather large compared to their intervals between conjunctions (5.23yrs for Vesta and 10.50yrs for Hygiea). I thus decided to investigate!
In the same way as I had done for Ceres, I used Solex to calculate values and plotted them out. The results are given below, including data for asteroid Pallas as well, together with the plot for Ceres as comparison. [Note that the scales are different in each case, to enable the detail of the peaks to be clearly shown].
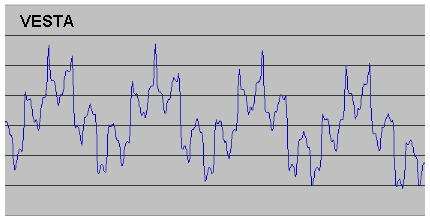
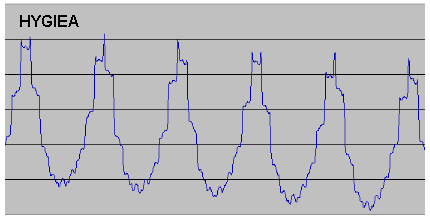
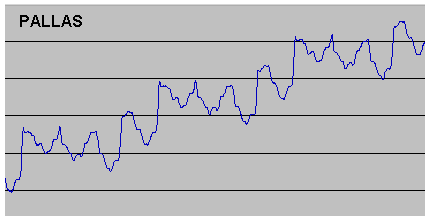
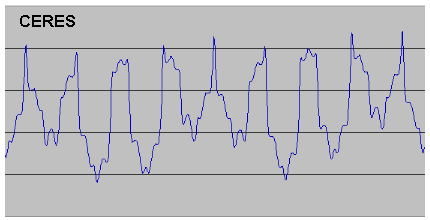
While there are obviously great differences in the plots, the periodicities are very clear. However, in the case of Vesta it was immediately apparent that the periodicity mentioned by Jean Meeus was not what I have called the "basic periodicity" (20.57yrs for Ceres) but the "super-periodicity" (77.13yrs for Ceres). The super-periodicity is much more obvious for Vesta than for Ceres, and so it could be taken for a basic periodicity, but the appearance of the smaller-scale fluctuations clearly shows this is not the case. Hygiea is very interesting as there really does seem to be just one periodicity. However, again this is not the case - the basic periodicity is still there, but almost invisible! The reason for this is the fact that the interval between conjunctions of Hygiea and Jupiter is very close to a whole number of orbits of Hygiea (1.886, in fact). This means that it is not possible to apply the process whereby (in the case of Ceres) an interval of 2 conjunctions [which is rather more than 3 orbits] can "compensate" for three intervals of 3 conjunctions [which are each a little less than 5 orbits] to give an overall result very close to a whole number of orbits and so keep the conjunctions in alignment with aphelion. Multiples of 1.886 simply get further and further away from a whole number, with the result that conjunction and aphelion drift apart very quickly. The osculating perihelion distance still changes of course (as the perturbations at each conjunction still have some effect) but as most of the perturbations will be far from aphelion there are few distinct short-period maxima in the curve and so we are left with only the "super-period". This is still present because after 8 or 9 conjunctions the point of conjunction will have travelled right round the orbit and so will be near to aphelion again. There will then be 1 or 2 distinct maxima before alignment is again lost. [The situation is in fact a little more complicated than this because, due to Hygiea having a very rapid precession rate, the point of aphelion itself moves around quite a lot, but this only changes the detail of the argument not its overall logic.]
I applied the same numerical analysis to Vesta and Hygiea as I had for Ceres, with the result that for Vesta the basic periodicity is 9.35yrs and the super-periodicity is 44.08yrs and for Hygiea the values are 10.50yrs [the period between conjunctions, as one would expect] and 91.04yrs. My calculated values are entirely consistent (to +/-0.1yrs) with values measured from the plots. The second number of each of these pairs is clearly the true value of the periodicities mentioned by Jean Meeus for Vesta and Hygiea. I then repeated the analysis for Pallas (mainly because Solex generates data for this asteroid as part of its default set!), and once more there was some interest. The plot has the usual "greatest maxima" at intervals, but this time a) the shape of the curve between each greatest maximum is identical, and b) the greatest maxima happen at perfectly regular intervals i.e. in this case the super-period is a true periodicity, not a quasi-periodicity made up of sequences of different lengths. The explanation for this is that because Pallas is fractionally further from the Sun than Ceres, and so has a slightly greater synodic period with Jupiter, a sequence of 3,2,1,2 & 3 conjunctions is now so close to a whole number of orbits (17.9998, in fact) that no further "compensation" is necessary in the super-period. Calculation shows that the basic periodicity for Pallas is 20.76yrs (very close to Ceres) and its super-period is 83.03yrs (greater than Ceres because its super-period is simply 11 conjunctions rather than an average of the sequence 11, 11, 8, 11 for Ceres).
I was pleased to find that the above results entirely support my explanation of the mechanisms behind both the basic period and super-period, and show that the theory can be used to describe very different behaviours of the osculating perihelion value. Unfortunately, my finding that the values of the periodicities mentioned by Meeus for Vesta and Hygiea are in fact super-periods and not basic periodicities did not find its way into "Morsels V" as Jean deemed the analysis to be too complex for the average reader (but not you, of course!).
Having carried out the analyses described above, I was encouraged to write up my research as a formal scientific paper, with a view to publishing it in the Journal of the British Astronomical Association (of which I am a member). I thus completed my studies by looking into several more detailed aspects of the periodicity of the variations, and also carried out a sensitivity analysis to show that my results were not just a temporary phenomenon caused by a short-term coincidence of orbital values, before submitting it for review. To read this fuller version of the article, click here - it will open in a new window/tab. My work also encouraged me to push for the modification of the template used by Wikipedia to give the orbital parameters of the asteroids, to include the long-term average orbital period (i.e. with the fluctuations described above averaged out) as well as the current mean period. After much discussion with other contributors, my amendment was accepted - my small contribution to posterity!