Unless you are a dedicated watcher of the skies and observe regularly for many weeks, you may not realise that the planets do not proceed across the heavens in a nice orderly manner but instead loop-the-loop, perform zigzags, go backwards and even stop moving entirely. Read on to find out why this should be so!
The observed path of a celestial body across the sky as seen from the Earth is composed of two elements - the "proper motion" of the object (i.e. the orbital motion in the case of a planet) and "apparent motion" caused by geometric displacements due to the orbital motion of the Earth. These two elements can be considered separately, then added together to give the true situation. Proper motion is thus calculated on the assumption that the Earth is stationary and apparent motion on the assumption that the planet is stationary: seems a little odd but it does work!
The most obvious of the geometric displacements is caused by parallax, the apparent shift of an object's position again a distant background when the observer's viewpoint changes. To illustrate this, point your index finger upwards and then hold that hand at arm's length. Close your left eye and place the finger so it covers an object some distance away when viewed with just the right eye. Now close the right eye and and view the scene with the left, keeping the finger still - you will see that the finger is now to the right of the distant object. i.e. an actual leftwards shift of viewpoint has caused an apparent rightwards shift of the viewed object. "Celestial parallax" is the movement of a distant object against the more distant starry background, caused by the Earth moving on its orbit around the Sun thus changing an observer's viewpoint by up to 186million miles (the diameter of its orbit) - see the diagram below.
Maximum parallactic displacement occurs when the Sun, Earth and viewed object form a 90deg angle, which for a distant object such as a nearby star will be at very nearly 6-monthly intervals, as shown above. For the the outer planets, however, because they are not actually all that far away (cosmically speaking!) the interval between this alignment happening on one side of the Sun and then on the other will be somewhat less than 6 months. In the case of Uranus it is 5months 22days, for example, but nose-dives to only just over 3 months for Mars as it is (relatively) so close. Note that during the time when the Earth is between the Sun and an outer planet the apparent movement of the planet due to parallactic shift will be in the opposite sense to its proper motion (as all planets orbit the Sun in the same direction) and so its observed motion will be less than its proper motion. Conversely, when the Earth is on the opposite side of the Sun from the planet its observed motion will be greater than its proper motion as the two elements will now add.
The above analysis of course only applies to the planets lying further out from the Sun than the Earth because in the case of the inner two (Mercury and Venus) the alignment Sun-Earth-planet can clearly never occur. They do have their own interesting apparent motions though, some aspects of which I explore in my theory article 'Periodicities in the observed position of the planets'.
A further complication arises because proper motion is constant but, due to the way the geometry works, apparent motion due to parallactic shift is not: it is greatest near the time when the Sun, the Earth and the planet are in a straight line [the alignment called "opposition"]. Given that for all the planets the overall parallactic displacement is greater than the movement due to proper motion, there will therefore be two instants, one before opposition and one after, when the proper and parallactic motions cancel, meaning the planet will appear to stand still for a while. Between these instants, parallactic motion will dominate and so the observed movement will actually reverse! As a planet approaches opposition, therefore, its forward movement (right to left as seen from the northern hemisphere of the Earth) will slow as the parallactic motion gets greater and for a moment it will actually stop. It will then begin to move backwards (left to right) before the decreasing effect of the parallactic motion after opposition causes it to pause again and then steadily accelerate away in forward movement until the next opposition.
 On the basis of a picture being worth a thousand words, here's an animation I found on the Internet which nicely illustrates what I've said above. It's drawn to scale, and the orbital speeds are also to scale: each successive frame represents about 20 Earth-days. The diagram clearly shows that as Earth catches up and then overtakes Mars the increasing parallactic motion eventually dominates the proper motion, causing the observed motion to reverse. As the Earth draws ahead of Mars the proper motion becomes greater again and so forward observed motion resumes. Note that the planet's stationary points take place when the line-of-sight between the Earth and Mars is on the point of changing its direction.
One of the great "what if" stories in astronomy concerns a stationary point. Galileo saw Neptune while he was observing Jupiter in December 1612 but recorded it as a star because it didn't appear to move. Unfortunately, fate had decreed he was seeing it near a stationary point! By the time he saw it again in January 1613 the weather only allowed him to make two observations (nothing changes!) which, with his crude telescope, would not have been enough to confirm its slight movement at that time. The planet thus had to wait until 1846 to be formally discovered.
The relationship between the extent of the "forward" and "reverse" movements depends on the relative amounts of parallactic and proper motion. There are actually two factors at work here: firstly, a greater amount of parallactic shift is almost bound to give a greater amount of reverse motion just by itself. Less obviously though, if the parallactic component is much larger than the proper motion component then it will more rapidly become dominant (causing the observed movement to reverse sooner) and will stay so for longer, thus extending the reverse sector. The ratio between the motions increases as the distance of the planet increases, so the further away a planet is the greater will be the extent of its reverse motion.
In the case of Uranus there is almost three times as much total parallactic displacement as proper motion in the same period. I fancy that the calculation of when that would cause the two opposing motions to cancel out and give a stationary point would be complicated, so I haven't attempted it! Roughly, however, during the "reverse" movement phase the two motions subtract and during the "forward" movement phase they add: the speeds (and thus the angles moved across the sky) during the two phases should thus be in about a 1:2 ratio [ i.e. (3-1):(3+1) ]. In fact, one of my astronomy programs shows that the true ratio is very close to 2 - it's actually 2.003! It also shows that the reverse-movement phase is traversed (from stationary point to stationary point) in 5months 3days rather than the 5months 22days between the points of maximum parallax i.e. it takes 19days for the parallactic motion to dominate over the proper motion.
If the forward phase has exactly twice the extent of the reverse phase, then a "reverse-forward-reverse" cycle should bring the planet back to where it started. A few more measurements showed that this is indeed the case - counting from the stationary point before opposition, there will be 4.27deg of reverse motion (taking 5months 3days), then 8.56deg of forward motion (taking 7months 2days), then a further 4.27deg of reverse motion placing the planet back to within just 1/8deg of where it was 17 months previously! Note that the difference between the forward and reverse phases (actually 4.285deg) is the annual proper motion of Uranus and the sum of the times taken for the two phases (actually 1yr 4.75days) is its synodic period [time between oppositions], as one would expect.
 In the case of Neptune and Pluto the ratio is below 1:2, which means that these planets actually overlap their previous paths: seen from above, their tracks would trace out a sequence of interlinking loops. The most well-known "opposition loop" is that of Mars, mainly because the motion happens so quickly: just 41/2 months for a complete circuit of the over 18degree loop. In this case the loop is also actually visible as such in the sky, because Mars' orbit is slightly inclined to that of the Earth, making the spectacle all the more dramatic. Loops at successive oppositions have different shapes depending on where Mars is placed in its orbit, ranging from a Z- or S-shape when it is passing through the plane of the Earth's orbit at opposition to ovals when it is as far as it can be to the north or south of the plane: see the diagram on the right. A full cycle through all possible shapes takes about 16 Earth-years: a more exact repeat is 47 Earth-years, as this is also 22 oppositions and 25 mars-years and so both planets will have returned to the same relative position on their orbits. The other planets, being further away and having very small inclinations, simply describe visual zig-zags rather than loops. Note that for Mars the reverse-movement phase takes 2months 13days rather than the 3months 7days between the points of maximum parallax i.e. it takes 24days for the parallactic motion to dominate over the proper motion. Demonstrating the points made above, this is a much greater percentage of the overall time than in the case of Uranus because Mars has only just over 1.5 times as much total parallactic displacement as proper motion compared with the 3 times for Uranus.
Never knew that such apparently simple concepts as the movement of planets across the sky could get so complicated, did you?
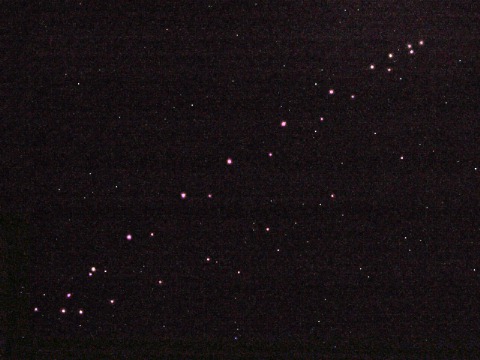 In 2007/08 I carried out a project to make a record of the opposition loop of Mars by taking one picture a week for several months, with the result shown here. The composite image shows the position of Mars against the background of the fixed stars at approximately weekly intervals, from 22nd September 2007 at mid-right to 6th April 2008 at bottom left. The actual interval depended mostly on the weather conditions (as ever!) and on the phase of the Moon [a bright Full Moon really doesn't help the taking of pictures of faint stars!] but I deliberately chose longer intervals near the times when the planet was changing from forward to reverse motion, and vice-versa, as its position changes more slowly then. Click/tap the picture to see a "joined up" version of the track.
Note that the loop was not at its greatest extent at the time of this project, being of type 4 (see above). Its "height" was about four times as great at the opposition of 2009/10, as Mars was then at the point of its orbit which is furthest north above the plane of Earth's orbit, thus giving the greatest angle between them: the loop was therefore of type 5. The "width" stays about the same, however, as this is determined by the relative distances of the planets, as described above.
As well as nicely demonstrating the loop described above, the image also shows how the brightness of the planet varies across opposition. The brightness depends on four factors:
The above effects are quite significant for Mars as it is reasonably close to the Earth at opposition. For example, at opposition on 24th December 2007 its distance was over 40% less than before opposition at the end of August 2007 and after opposition at the end of March 2008, thus increasing its relative brightness at opposition very considerably. In addition, its phase was only 85.75% and 89.89% at the same before and after dates, thus decreasing its brightness then due not only to the smaller illuminated area but also because Mars' surface exhibits a similar effect to that of the Moon. There is thus a "double whammy": an increase at opposition and a decrease both before and after. The rather non-circular orbit of Mars does also have an effect, which varies depending on where it is in its orbit at opposition. If the Earth meets it at perihelion (i.e when it is nearest to the Sun) then there will be an accentuation of the brightness change as the Sun-Mars distance is least exactly at opposition. Conversely, an opposition at aphelion (farthest away from the Sun) will suffer a reduction in brightness change as the Sun-Mars distance is greatest then. For intermediate situations, the brightness curve will end up "skewed" (i.e. asymmetric) because the Sun-Mars distance will be greater on one side of opposition than the other. There will also be an effect on the Earth-Mars distance and thus on the phase, as the geometry before and after opposition will be slightly different. This asymmetry was well shown by the studies I did on the brightness change at the opposition in 2007, which was well past the half-way point between perihelion and aphelion. This meant that the Sun-Mars distance after opposition was 11% greater than it was before, causing the "downslope" side of the brightness curve to be steeper than the "upslope" side. In fact, it took 13wks to rise but only 9wks to fall.
The other outer planets are much further away at opposition, so the distances don't change by such a percentage and the angles involved are smaller, which means their phase is always close to 100% (Jupiter never gets below 99%, for example). Because of these factors, Mars brightens much more at opposition than do the other outer planets: 1.67 magnitudes [4.66 times brighter] in the above instance compared to about 0.6 magnitudes [1.74 times brighter] for both Jupiter and Saturn in 2008.
 These graphs illustrate the above points very well. Brightness is blue, distance to the Earth mauve, distance to the Sun yellow and phase turquoise. Each data point has been normalised (i.e. expressed as a fraction of the highest value) so the results for the two planets can be directly compared BUT note that the vertical scale for Jupiter (on the right) is expanded by a factor of 2 compared to Mars!
It is clear that Mars brightens much more rapidly than Jupiter, achieving in two weeks the same percentage brightness increase that Jupiter needs seven weeks for (from the 0.80 level to maximum) and also having a much greater brightening overall. The latter is due to the greater percentage decrease in the Earth-planet distance in the case of Mars, the former to the phase effect giving Mars' graph a much sharper peak: observe that the phase of Jupiter barely changes whereas that of Mars has a marked hump. Note also the skew of the brightness and phase curves for Mars, caused by the variation of Sun-planet distance (as explained above). There is actually a very slight asymmetry in Jupiter's brightness curve, but in the opposite direction as it gets just a bit closer to the Sun across this opposition.
The situation for Saturn is complicated by its rings, as the amount of light they reflect is dependent not only on the factors listed above but also on their "tilt", which [as I show on my Saturn page in the Astrophotographs section] is different at each opposition (on a 29.5yr cycle). Calculation shows that the rings often contribute more to the overall brightness than the planet itself: they can add almost a whole magnitude when they are "fully open". However, like the Moon and Mars, as you move away from viewing them "straight on" they reflect less light than might be expected due to their particulate make-up. Thus when the rings are fully-open the brightness curve has a marked peak, like that of Mars and for the same reason. As the rings close up the impact of this effect is reduced and so the peak becomes less pronounced.
 The left-most graph here shows the situation for Saturn at the opposition of 2002/03 when the rings were fully-open - it is colour-coded as for Mars and Jupiter above and to the same scale as Jupiter. Note how the "distance to Sun" and "phase" lines are almost flat, showing they barely change. The blue (brightness) line shows some of the peakiness of Mars' graph but less markedly. The light-blue line shows how the brightness would change if the rings did not exhibit their dependence on illumination angle - much more like Jupiter.
The right-most graph illustrates the point about the dominance of the rings. The lower (mauve) curve shows how the magnitude of Saturn would change over fifteen successive oppositions if it had no rings - a cyclic decrease due to an increasing distance from the Sun (and hence the Earth) because of the eccentricity of Saturn's orbit. The upper (blue) curve shows what will really happen. In 2002 the rings added about 1 magnitude to the total brightness but as they close up towards 2009/10 their contribution decreases rapidly leading to a very sharp fall-off in brightness. After 2010 the rings begin to open up again so that even when the planet itself is becoming dimmer the overall brightness still goes up due to the increasing contribution of the rings.
Saturn displays yet another brightening effect near opposition, the "opposition surge", when the rings suddenly brighten for a day or so each side of opposition. This happens because the shadows thrown by the countless rock and ice fragments making up the rings point directly away from the Earth when the Sun, Earth and Saturn are in a straight line i.e. at opposition. The consequence of this is that the rings as a whole get considerably brighter as the shadows are no longer falling on, and thus dimming, other fragments as seen from the Earth. Note that this is a different effect from that caused by the dependence of the albedo on illumination angle, which is concerned with differences in reflection properties. I managed to capture the brightening in January 2005 without actually realising it! I had noticed that images near to opposition were considerably brighter but didn't know why - I do now! To see my images, look at the Saturn page in the Astrophotographs section.
The remaining outer planets, Uranus and Neptune, are so far away that all the effects discussed above are almost negligible: for example, the absolute minimum phase of Uranus is 99.94% (and that's at 3months before and after opposition). Because they move so slowly the Sun-planet distance is also effectively constant through an opposition. The only factor that does change is the Earth-planet distance, but only by a small percentage as the difference is just +/-5% during the course of an entire year in the case of Uranus. All this means that their brightness barely change at all, let alone across an opposition: in 2007 Uranus only varied from magnitude 5.73 when nearest to the Earth to 5.94 when farthest away, for example.
So, when Mars suddenly brightens near the next opposition you can confidently say "ah yes, that's the phase effect kicking in". Sounds impressive, anyway!